Published on Jul 07, 2022
When I started coding in python, whenever my script crashed with some traceback,
I would start adding prints here and there and would re-run the script as many
times as needed to figure out what's wrong. Now, this approach works, but takes
a lot of time and may be quite frustrating (Where should I put prints? What should
I print?).
Here, I would like to show a different approach using python's built-in debugger (and some alternatives). This article should serve as a guide mainly to PDB, but also to debugging in general.
Simple example
Imagine you have a simple script that just requests some URL and tries to convert the response to JSON, like this
# example.py
import requests

response = requests.get("https://example.com")
json_response = response.json()
When you run this script, it will fail with a traceback similar to this one:
Traceback (most recent call last):
  File "/home/libor/venv/lib/site-packages/requests/models.py", line 971, in json
    return complexjson.loads(self.text, **kwargs)
  File "/home/libor/venv/lib/json/__init__.py", line 346, in loads
    return _default_decoder.decode(s)
  File "/home/libor/venv/lib/json/decoder.py", line 337, in decode
    obj, end = self.raw_decode(s, idx=_w(s, 0).end())
  File "/home/libor/venv/lib/json/decoder.py", line 355, in raw_decode
    raise JSONDecodeError("Expecting value", s, err.value) from None
json.decoder.JSONDecodeError: Expecting value: line 1 column 1 (char 0)

During handling of the above exception, another exception occurred:

Traceback (most recent call last):
  File "/home/libor/example.py", line 4, in <module>
    json_response = response.json()
  File "/home/libor/venv/lib/site-packages/requests/models.py", line 975, in json
    raise RequestsJSONDecodeError(e.msg, e.doc, e.pos)
requests.exceptions.JSONDecodeError: Expecting value: line 1 column 1 (char 0)
The traceback is telling us there is something wrong with deserializing data to JSON. Common approach to get to know what went wrong would be to print pretty much everything relevant. The altered code might look like this
import requests

response = requests.get("https://exmple.com")
print(response)
print(dir(response))
print(response.status_code)
print(response.text)
json_response = response.json()
That's a lot of prints to get an idea of what's wrong, and once you do, you have to remove them all (well, at least if this was production code).
Let's try a different approach using PDB. To invoke our script in PDB, we don't have to
install any extra libraries as it is a part of the standard libraries. To start debugging,
run python -m pdb example.py, which in human language means "invoke module pdb with argument my-script".
Once you do so, you will see an output something like this
/home/libor/my-script(1)<module>()
-> import requests
The first line is telling us that we are on the first line of the script example.py
and the second line shows the code on that line. There are now several ways on
how to proceed, and the PDB's interactive shell also supports some help.
We can see the help page by typing h (or help) and hitting enter. The help
shows all the available commands and their shortcuts. The full reference to the
commands can also be found in the documentation. Let's start with what
I personally find the most useful - breakpoint. We can break the script execution
at any line (before a crash occurs) and inspect our variables and code.
When you check the PDB's help or the documentation, you can see there's break.
The syntax of setting a breakpoint can be as simple as b 4, telling the
debugger "stop execution on line 4 of the current file". But it can be much more
complicated (that's the true power of the breakpoints), more on that later.
When you type that and hit enter, the PDB will in return tell you where the
breakpoint is set.
When the breakpoint's set, let's execute the script by running c (or continue).
The execution will stop on line 4 just as we wanted and the PDB will output
something like
> /home/libor/example.py(4)<module>()
-> json_response = response.json()
At this moment we can hit c again and the program will fail. Or we can start
inspecting what's wrong. Let's do the latter. To print a variable (or expression)
simply do p <expression>. So in this case we could do
(Pdb) p response
<Response [200]>
(Pdb) pp dir(response)  # pp stands for prettyprint, dir is built-in function for showing all the methods and attributes on an object
[...
<some attributes>
...]
(Pdb) p response.status_code
200
(Pdb) p response.text
<some HTML string>
After issuing the last command, we can see that the response is not a JSON but HTML,
so that's what's wrong with the code. Now we can simply exit the debugger using
q or quit and start fixing our code.
I know, I know, this was a lot of work for a very trivial example, but when coding a real script / application / tool / whatever, all this may actually come in handy. Especially when reproducing the crash is not easy or it takes significant amount of time (you don't want to add print here and there, run the code, go grab a coffee to come back and finding out that the print printed something useless and you are back where you started).
Until here I was mainly giving the examples of how to do some things. Let's dive deeper and properly now. I will start with all the ways of how to trigger the PDB, then going through the commands and their optional parameters. Finally, I will go through alternative debuggers, that can be often found in the Python world, and their pros and cons.
Invoking PDB
We have already seen one way of invoking the PDB. It's by running command
python -m pdb <script>. This way works but often the debugged code is not a
simple script and in case of larger project with multiple files, it's not very
convenient to do it this way. The reason is simple, mostly you run the debugger
because you want to set a breakpoint somewhere, and running the code this way
would require you to type the full path to the file where you want to set up
the breakpoint. There are simpler ways of doing it.
From python version 3.7 there is a new built-in function called breakpoint()
(guess what it does). Just for completion, before python 3.7 you would have to
do import pdb; pdb.set_trace(). Once the executed code hits the line with
this function call, it drops the execution to the PDB. This is very convenient
way of debugging when you know approximate or exact place in your code where a
crash occurs and you want to inspect under what condition it happens.
There is also another way of invoking PDB. Let's say you are running your code
from some main() function like this
if __name__ == "__main__":
    main()
A simple alteration to the code will drop you to the debugger once there is an exception, allowing you to inspect stack and variables on it.
import pdb

if __name__ == "__main__":
    try:
        main()
    except Exception as e:
        pdb.post_mortem()
These are the ways how to invoke the debugger. Let's look at the power the debugger gives us.
PDB commands
We have already seen some of the commands that can be issued to the debugger.
When we run help inside the debugger, we can see all the available commands.
Navigation
First we will need commands for navigating in the code. We have already seen
c(ontinue) which runs the code until it hits the next breakpoint. For executing
only current line, we have n(ext) and if we want to step into a call there is
s(tep), if the call is nested, it will step into the inner most call, then the
second inner most, etc... There is also r(eturn) that continues until it hits the
return line (in case function is not returning, it will stop on the last line).
Let's see these comands in action debugging a simple script
# navigating.py
def inc(x: int) -> int:
    print(x)  # just to make this function a bit longer
    x += 1
    return x


if __name__ == "__main__":
    number = inc(2)
    print(number)
Running python -m pdb navigating.py will drop us directly to the debugger with output like this
> /home/libor/navigating.py(1)<module>()
-> def inc(x: int) -> int:
Meaning that we are on the first line of the script being debugged. By issuing command n
the execution moves on to the line 7 with if __name__ == "__main__":, skipping the inc
function. We can now simply hit enter which issues the last command moving the execution
to the line 8 with the output
> /home/libor/navigating.py(8)<module>()
-> number = inc(2)
We now may want to step into the inc function call. That can be done by issuing s
command, moving us back to the line 1. However, if this time we issue n, it won't
move to the line 7 again, but to the line 2.
Issuing r at this moment will execute everything up to the return line (line 4) and stop there.
It also means the print on line 2 will output 2.
And finally issuing c will continue the program until it stops. It should
execute the print on the last line of the script outputing 3 and say
The program finished and will be restarted. At this moment we are back
on the line 1 and we can run all the commands again. To stop the debugger
use q(uit).
Listing source code
Now that we know how to navigate in debugger, it would be also nice to list the source code, because frankly, having to open a file containing the function we just stepped into would be tedious.
For that pdb offers two commands. First of them is l(ist), it lists 11 lines around line but when issued again,
it lists next 11 lines. The command also takes 3 optional parameters, you can read how they work in the
docs. The second command is ll or longlist, which
lists the source code of current frame - it can be function, method, class or the whole file. These commands are
quite intuitive, so I will skip examples of their usage.
Breakpoints
With navigating and listing source code, we have solid basics for starting to place breakpoints.
Of course, we can always use simply breakpoint function, but sometimes it is more convenient
to use breakpoint functionality provided by pdb.
Firstly let's look into documentation:
b(reak) [([filename:]lineno | function) [, condition]]
This looks a bit complicated, but all parameters from the first square bracket are optional.
It also means we can use just b(reak), but more on that later.
The easiest usage is b <linenumber>, which places a breakpoint in current file to line
linenumber. We can also specify some other file using b file:<linenumber> which will
place breakpoint into file to the specified line number. Also instead of linenumber we
can use function name, but that sounds like too much typing. If we know the function name,
we also know the line number (or at least modern IDEs should be able to tell us), so why
bother with names. When we have specified breakpoints, we can simply run c and wait until
it hits some breakpoint. Let's see that in action. We will use the previous example navigating.py:
python -m pdb navigating.py
Following output should show:
> /home/libor/navigating.py(1)<module>()
-> def inc(x: int) -> int:
Let's list the source code, so we can see where to put the breakpoint:
(Pdb) l
  1  -> def inc(x: int) -> int:
  2         print(x)
  3         x += 1
  4         return x
  5
  6
  7     if __name__ == "__main__":
  8         number = inc(2)
  9         print(number)
[EOF]
There are not really many interesting places where to put a breakpoint, but
line 8 looks promising, as there is a function call. So now command b 8
will do that and we should see:
(Pdb) b 8
Breakpoint 1 at /home/libor/navigating.py:8
Alternatively, we could use b navigating.py:8 or specify the full file path b /home/libor/navigating.py:8
(be sure to use your path, not mine :)).
This says we have a breakpoint with id 1 set to line 8. We now need not use n
or s to 'slowly' get to the line, instead we can just run c and the debugger
will stop there on (any) encounter.
(Pdb) c
> /home/libor/navigating.py(8)<module>()
-> number = inc(2)
One more thing about placing breakpoints remain - conditioned breakpoints. Consider code like this:
# iterating.py
items = ["banana", "apple", "orange"]

for item in items:
    print(item)
If we placed simple breakpoint on line 4 and run c, the debugger stops there. If now we wanted the
debugger to just run until the end and simply issued another c, we end up on the same line.
The reason is simple, we placed a breakpoint into loop and the loop runs 3 times. This might be tedious,
especially if we only want to break in loop undder given conditions and we don't want to inspect all
the other cases. Lucky for us, we can simply use b 4, item == "apple" and the c command will only
break on line 4 if item is equal to "apple".
We have seen all the possible parameter choices for b(reak), but what does it do without any parameters?
It simply lists all the breakpoints we have set. If we continue with the previous example and
put in b we will get
(Pdb) b
Num Type         Disp Enb   Where
1   breakpoint   keep yes   at /home/libor/iterating.py:4
        stop only if item == "apple"
With this in hand, we can disable or enable a breakpoint and we can delete it by its id.
Using disable 1 in the previous example will disable the breakpoint
(Pdb) disable 1
Disabled breakpoint 1 at /home/libor/iterating.py:4
If we now continue the debugger, it will run till the end of the script. We can enable the breakpoint
again by using enable 1 or remove it by running clear 1. We can also remove all breakpoints
by running clear, this will prompt us Clear all breaks? and by y we confirm it.
There is also (ignore)[https://docs.python.org/3/library/pdb.html#pdbcommand-ignore]
command that can be used like ignore bpnumber [count]. It will ignore breakpoint count times
and then enable it again.
One convenient way of getting to some place is a tbreak. It has the same syntax as normal
breakpoint but it 'disappears' the first time its hit. This can serve well when we want to
reach some place in the code without setting there a permanent breakpoint (e.g. frequently called function).
Another convenient way of moving forward in the code execution is using unt(il), which only
works in the current frame. Let's say we simply want to move few lines in the current function without setting
a breakpoint, then using unt(il) is the best way to do so. Again to see this in the previous example:
(Pdb) unt 4
> /home/libor/iterating.py(4)<module>()
-> print(item)
Inspecting variables, evaluating expressions
We have tools needed for navigating in the code, and we should be able to get to the critical parts
of the code. But when we get there we also want to be able to inspect variables and evaluate expressions
to get (ideally all) informations necessary for fixing the code. For that we have several options. One
of the simplest is to print arguments of current function, to do that just run a(rgs). We can see that on
the navigating example:
python -m pdb navigating.py
> /home/libor/navigating.py(1)<module>()
-> def inc(x: int) -> int:
(Pdb) ll
  1  -> def inc(x: int) -> int:
  2         print(x)
  3         x += 1
  4         return x
  5
  6
  7     if __name__ == "__main__":
  8         number = inc(2)
  9         print(number)
(Pdb) unt 8
> /home/libor/navigating.py(8)<module>()
-> number = inc(2)
(Pdb) s
> /home/libor/navigating.py(1)inc()
-> def inc(x: int) -> int:
(Pdb) a
x = 2
Even better are commands p(rint) and pp (prettyprint), let's see them in action.
For these commands we don't really need any file to debug, we just need to get into
a debugger, let's just use some file to get there but ignore everything in it.
python -m pdb iterating.py
> /home/libor/iterating.py(1)<module>()
-> items = ["banana", "apple", "orange"]
(Pdb) p list(range(23))
[0, 1, 2, 3, 4, 5, 6, 7, 8, 9, 10, 11, 12, 13, 14, 15, 16, 17, 18, 19, 20, 21, 22]
(Pdb) pp list(range(23))
[0,
 1,
 2,
 3,
 4,
 5,
 6,
 7,
 8,
 9,
 10,
 11,
 12,
 13,
 14,
 15,
 16,
 17,
 18,
 19,
 20,
 21,
 22]
(The output may differ based on your display size. If the pp prints values in row, increase the range to e.g. 100)
What happens here is that p(rint) prints out whatever representation of given object.
In case it was a container such as dict or list, it would print it in a line regardless length.
On the other hand pp looks at what the object to be printed is and tries to fit it into some
line length, making it somewhat easier for the reader to read the output.
On the above example there is also one more thing worth noticing, p and pp evaluate expressions.
This means we can give it whatever expression available in the scope of current frame and it
will be evaluated. This is the real power of pdb.
Not only can we evaluate expression available in the current scope, we can also create our own scope. When I return to the previous example where we ended, we can do for example this:
(Pdb) import requests; requests.get("https://example.com")
<Response [200]>
Walking stack
This section is just to make our life easier. When we are debugging, we can
print the whole stack and move on it up and down. The commands are w(here)
for printing the stack, u(p) for moving up and d(own) for moving down.
Let's see an example of a nested calls:
# nested.py
from typing import Any, Dict

import requests


def get_response_json(url: str) -> Dict[str, Any]:
    response = requests.get(url)
    return response.json()


def main(domain: str) -> None:
    url = "https://" + domain
    data = get_response_json(url)


if __name__ == "__main__":
    main("example.com")
And debugging the inner most function:
python -m pdb nested.py
> /home/libor/nested.py(1)<module>()
-> from typing import Any, Dict
(Pdb) b 8
Breakpoint 1 at /home/libor/nested.py:8
(Pdb) c
> /home/libor/nested.py(8)get_response_json()
-> return response.json()
(Pdb) w
  /home/libor/venv/lib/bdb.py(597)run()
-> exec(cmd, globals, locals)
  <string>(1)<module>()
  /home/libor/nested.py(17)<module>()
-> main()
  /home/libor/nested.py(13)main()
-> data = get_response_json(url)
> /home/libor/nested.py(8)get_response_json()
-> return response.json()
At this moment we can see printed stack similarly as when our script crashes.
Let's move up to the main function and see what was the value of domain variable
(Pdb) u
> /home/libor/nested.py(13)main()
-> data = get_response_json(url)
(Pdb) ll
 11     def main(domain: str) -> None:
 12         url = "https://" + domain
 13  ->     data = get_response_json(url)
(Pdb) p domain
'example.com'
We can also move back to the get_response_json function using d and at any point
if we use w it will print the whole stack with an arrow indicating the frame we are
currently in.
PDB cons
There are some cases where PDB won't be of much help.
First of all debugging C or cython code requires gdb or other c debuggers.
Debugging threads and multiprocesses in pdb doesn't work very well, there's no way to switch between threads, processes and continue execution of just that one.
Allternative debuggers
iPDB
iPDB is a third party debugger that makes the user experience somewhat better especially because it offers syntax highlighting. The commands are the same as for plain pdb.
It can be installed simply by pip install ipdb and invoked similarly as pdb,
for example python -m ipdb navigating.py.
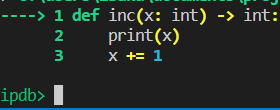
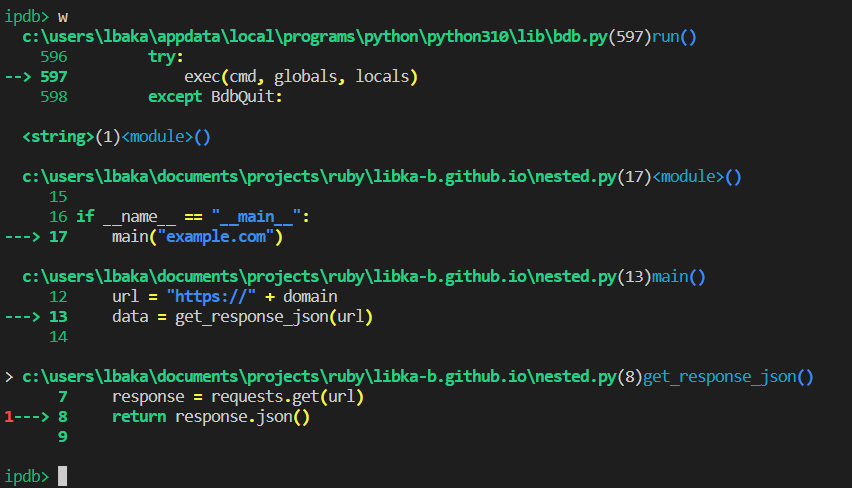
I personally dislike it for its verbosity, especially when it comes to inspecting the stack. Let's see example:
python -m ipdb nested.py
> /home/libor/nested.py(1)<module>()
----> 1 from typing import Any, Dict
      2
      3 import requests

ipdb> b 8
Breakpoint 1 at /home/libor/nested.py:8
ipdb> c
> /home/libor/nested.py(8)get_response_json()
      7     response = requests.get(url)
1---> 8     return response.json()
      9

ipdb> w
See the result here
But I believe iPDB can be useful especially when it comes to learning with debugger.
PyCharm's debugger
PyCharm's debugger is great especially when it comes to debugging threads and multiprocesses. You can simply place breakpoint anywhere in the code and it stops the execution there. It also allows to switch between threads and processes and inspect their variables.
Conclusion
PDB is great debugger for most of the developer's work. It's also useful to be familiar with it because it comes bundled to every python installation, so whenever you have to debug a code outside your environment, it's possibly the only option you have.